US Rental Investment Markets
Where should you buy rental property in the US? This page ranks 4325 cities by investment metrics derived from Zillow’s public home value and rent indices. The price-to-rent ratio is the standard benchmark:
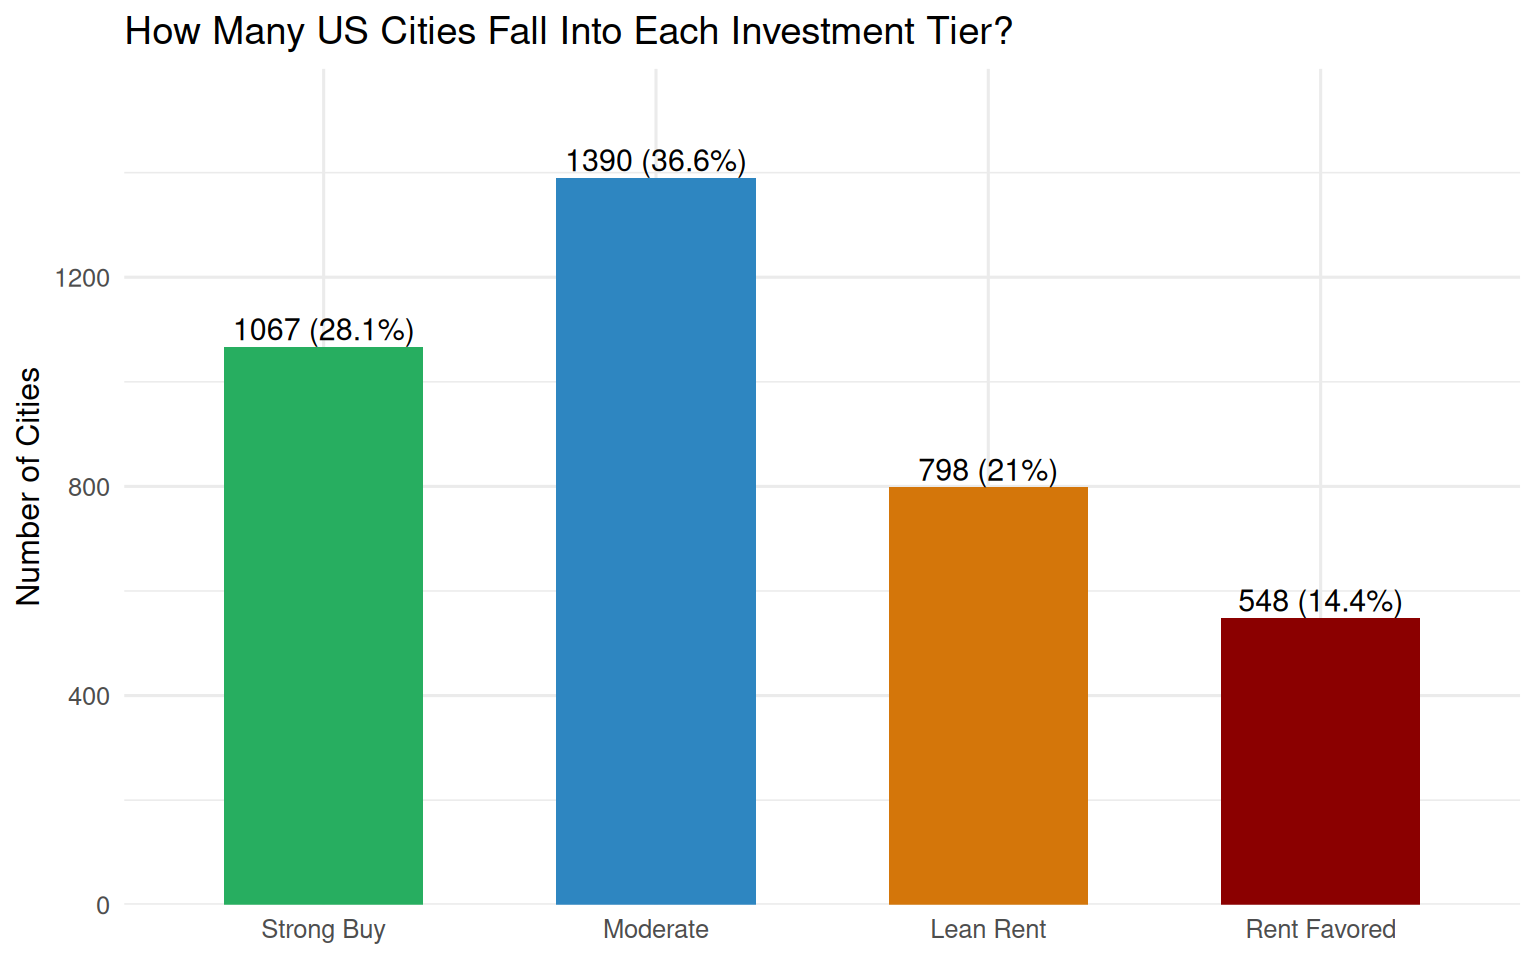
- Strong Buy (P/R < 15): Cash flow positive from day one
- Moderate (P/R 15–20): Reasonable returns, some appreciation upside
- Lean Rent (P/R 20–25): Marginal; depends on appreciation
- Rent Favored (P/R > 25): Buy only if you’re betting on price growth
Data Sources
All data is traceable and reproducible. Run
Rscript scripts/us_rental_markets_data.R to refresh.
| Data Sources | ||
| All public, no API key required | ||
| Source | Description | Updated |
|---|---|---|
| Zillow ZHVI | Typical home values (city level, SFR+condo, 35th–65th percentile) | 2026-05-31 |
| Zillow ZORI | Typical observed rents (city level, SFR+condo+MFR) | 2026-05-31 |
| Census Pop Estimates | City + county population (2020–2024), net migration | V2024 |
| Census ACS 5-Year | Vacancy rates, renter %, housing counts (county level) | 2019–2023 |
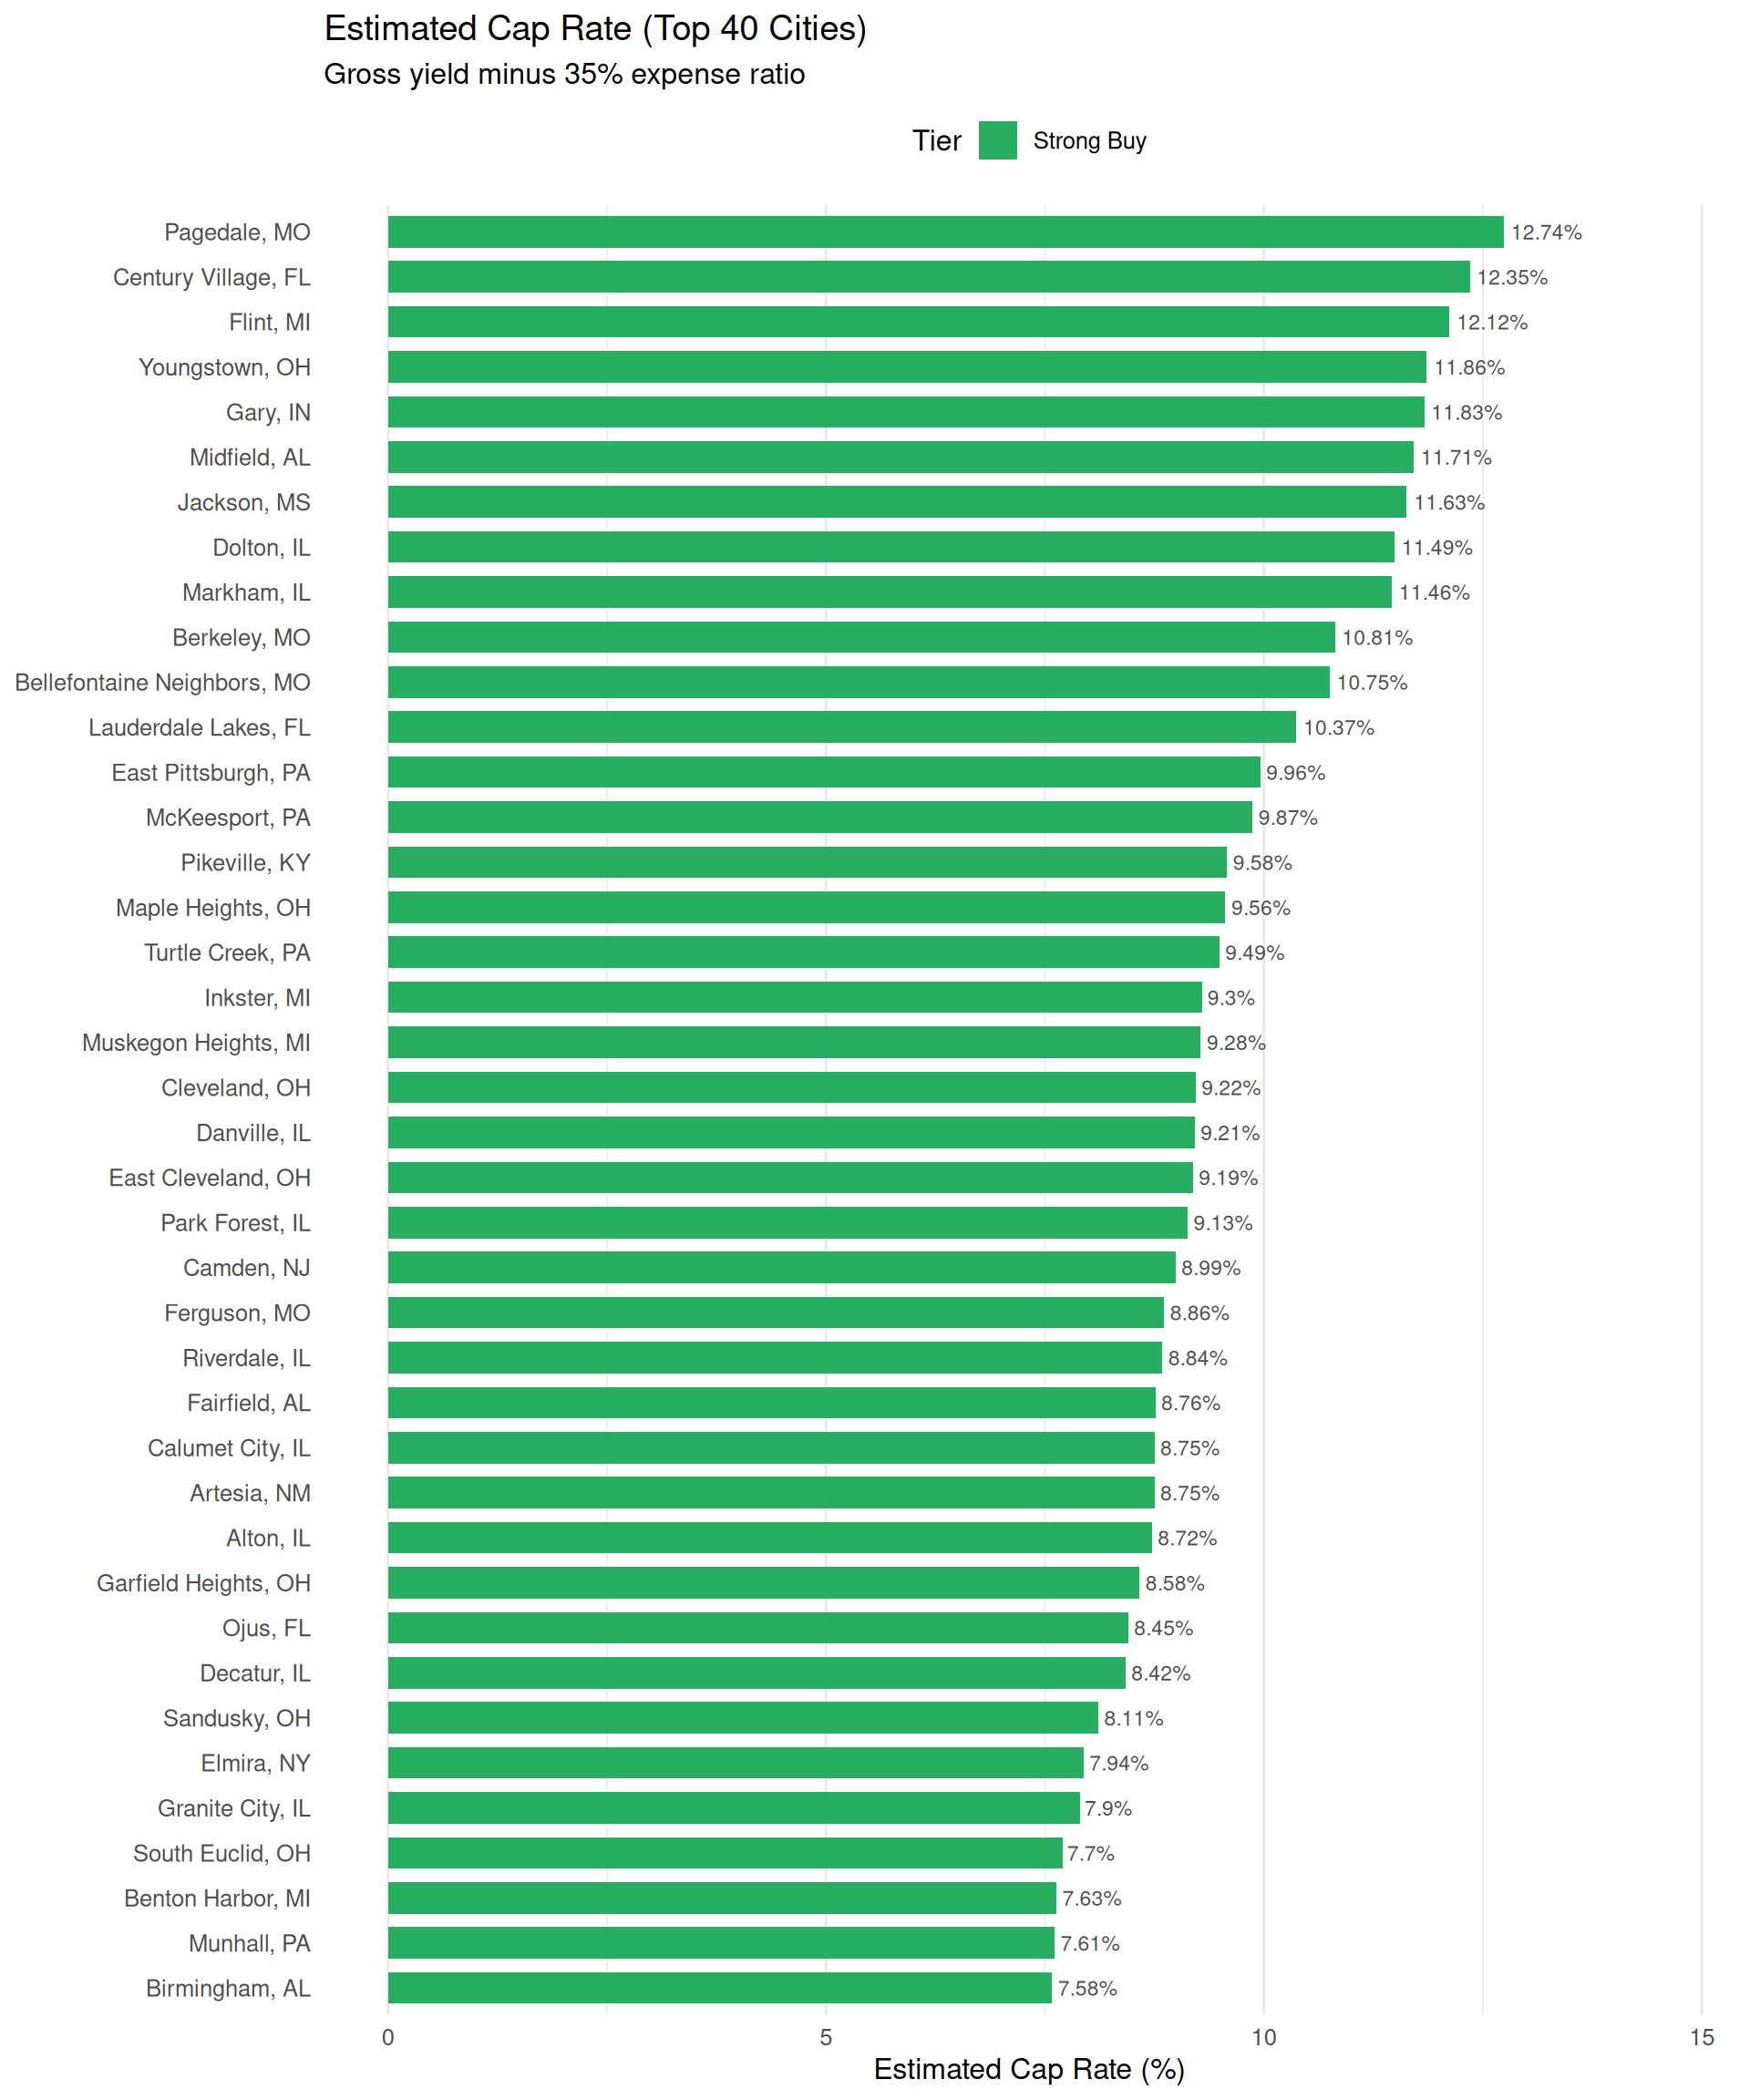
| Cap rate = gross yield × (1 − 35% expense ratio). Raw data: us_rental_markets.csv | ||
Top 40 Cities by Cap Rate
Bar Chart
Interactive Table
Show table
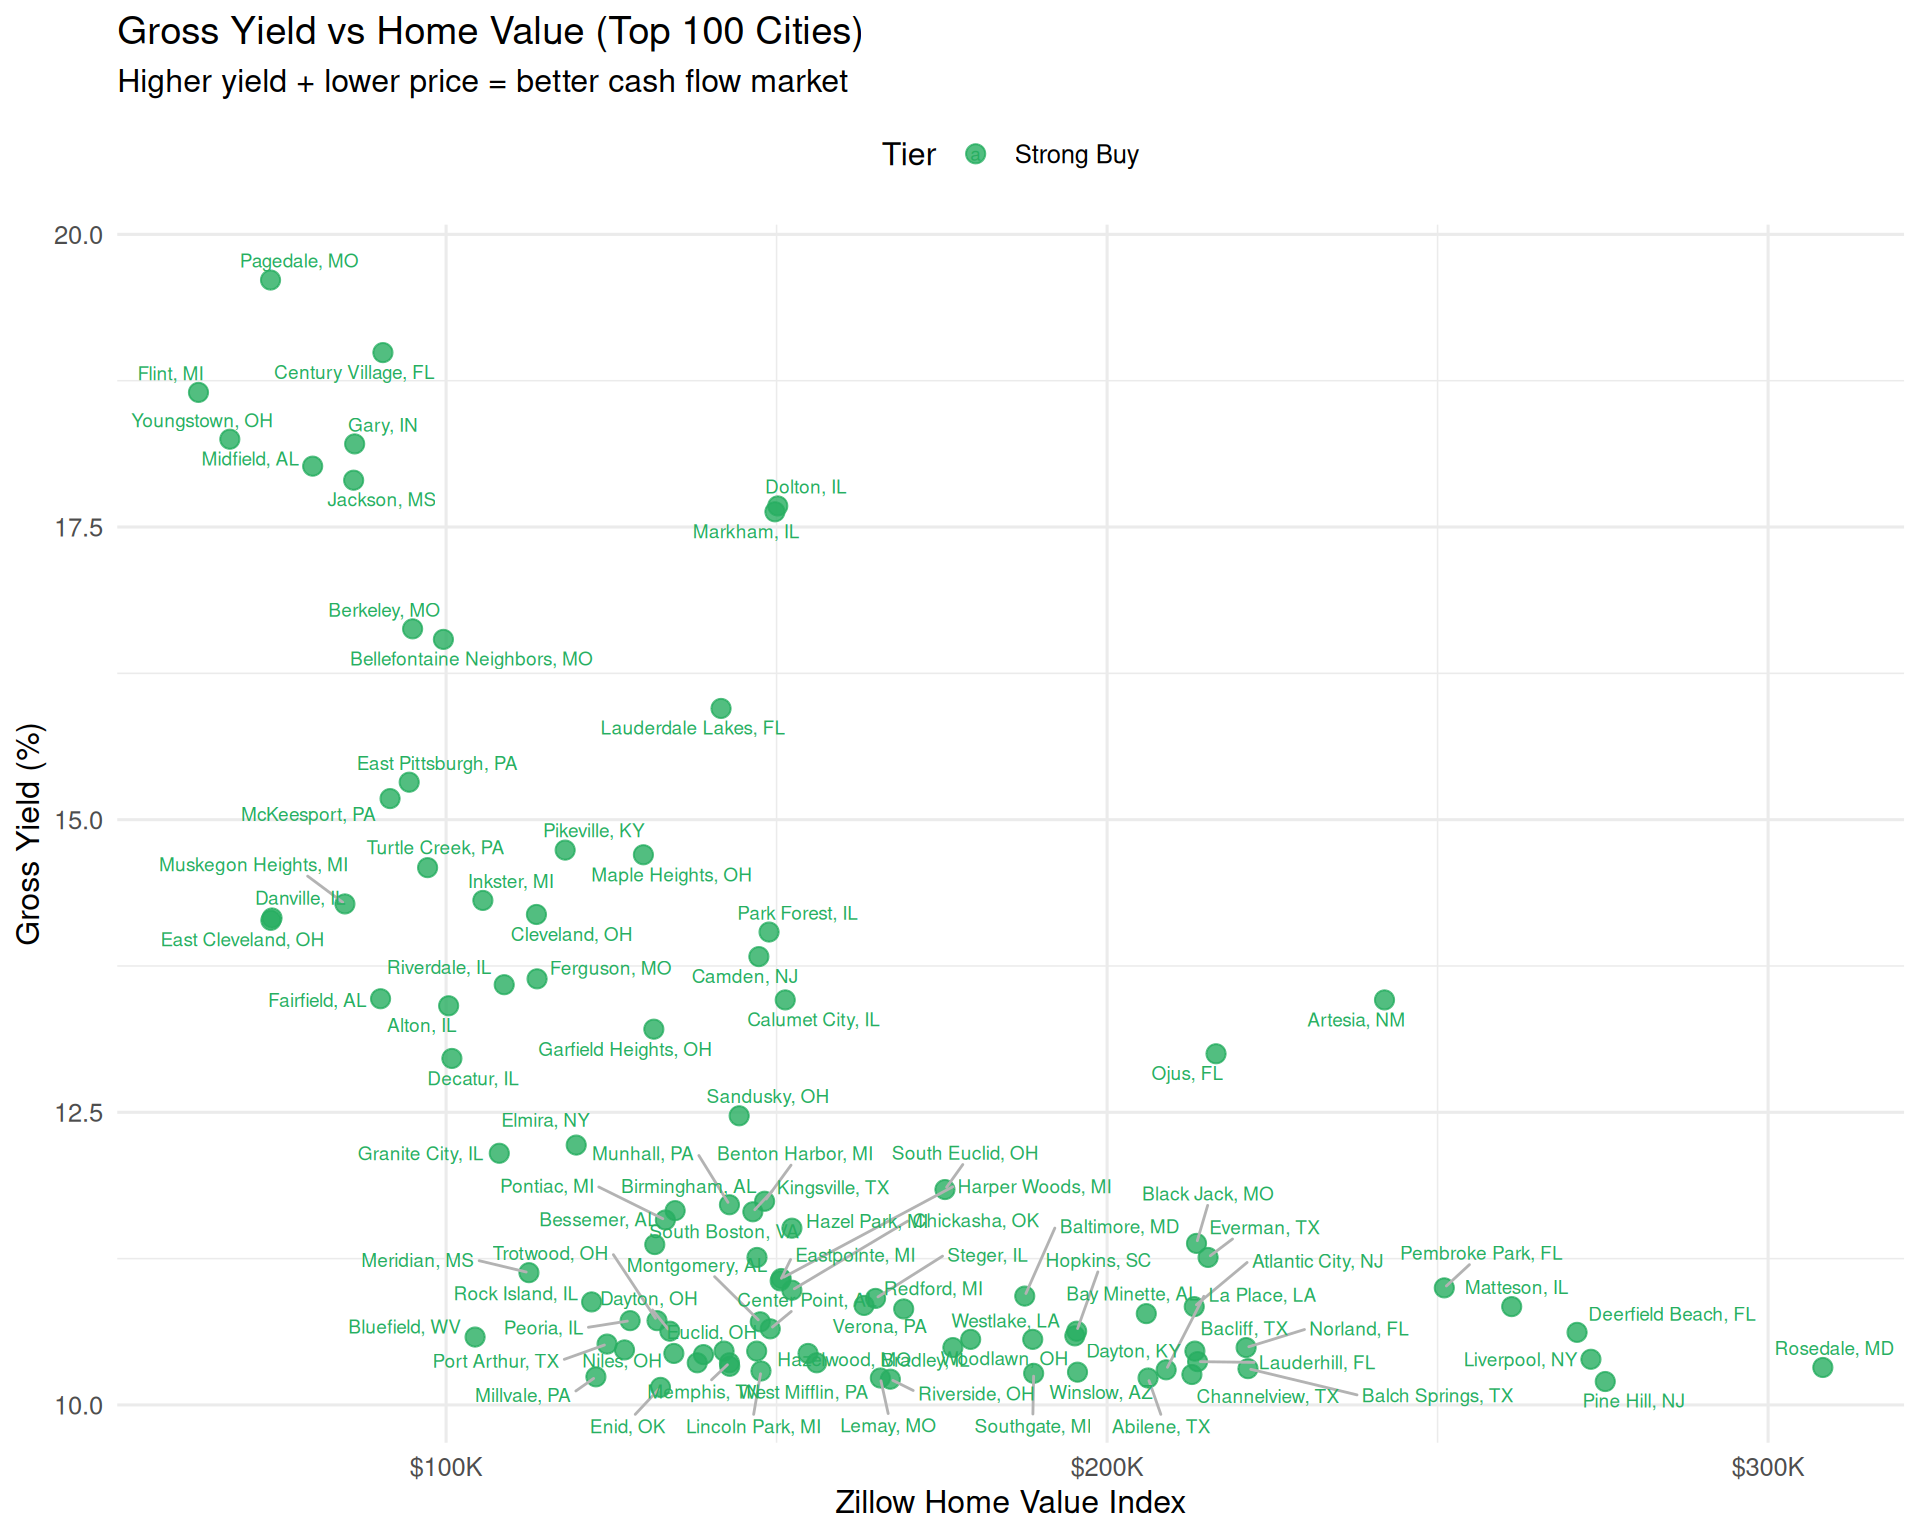
Gross Yield vs Home Value
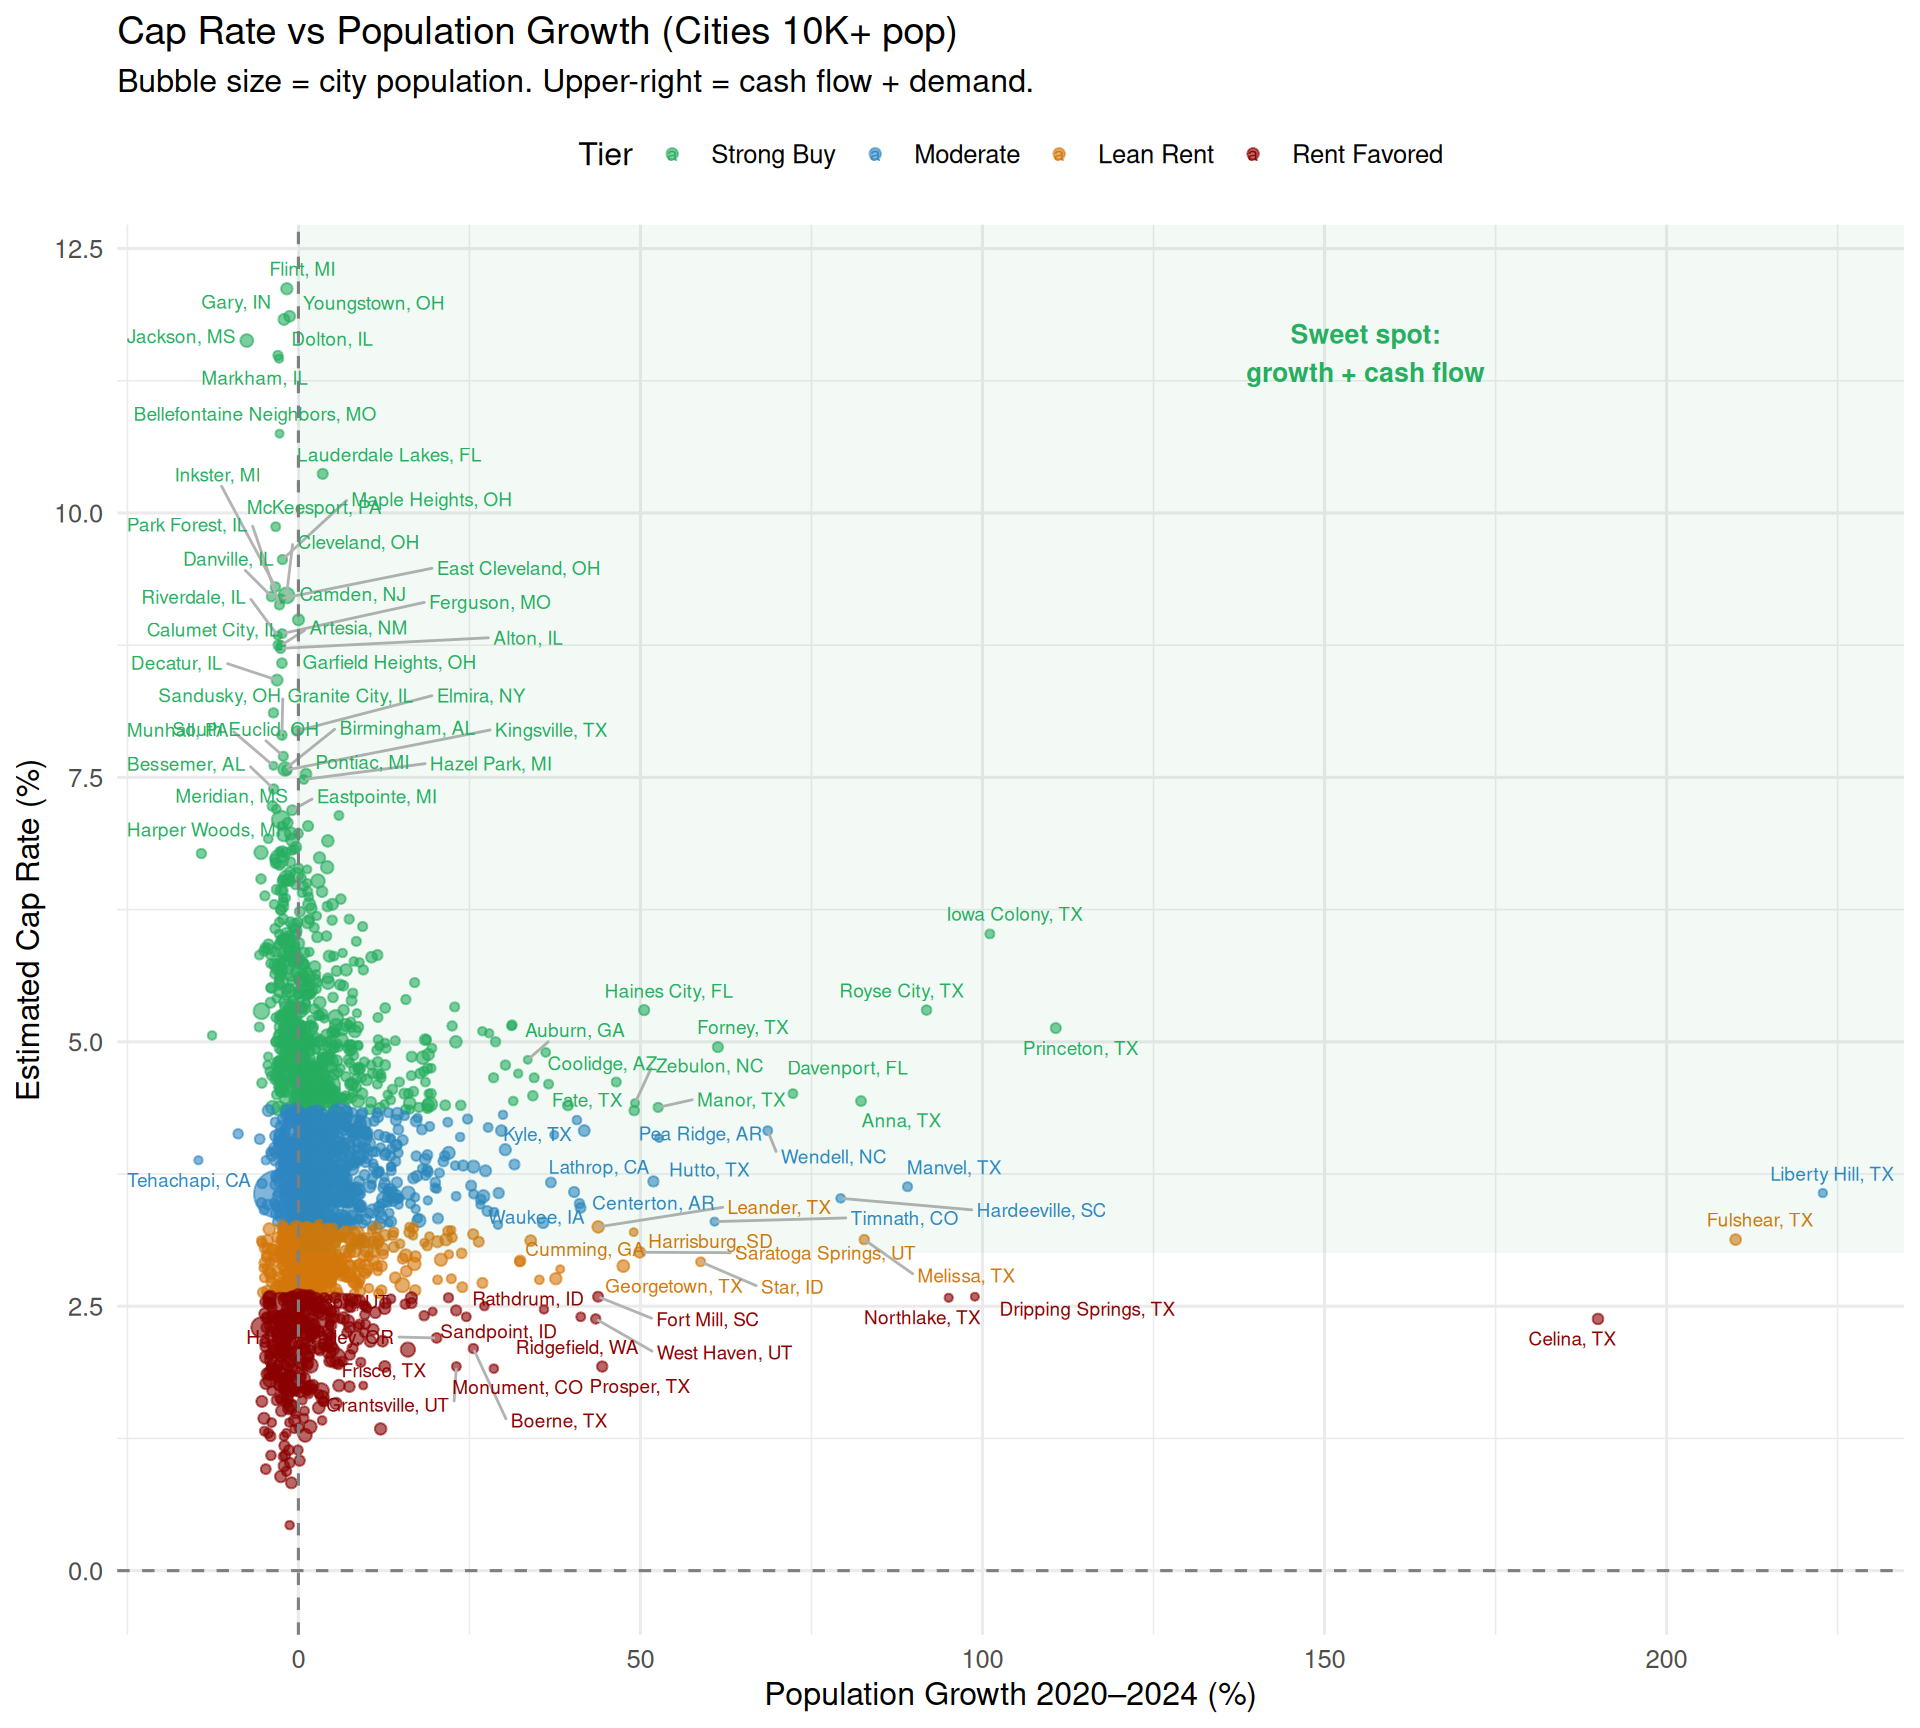
Demand Health Check: Cap Rate vs Population Growth
High cap rate means nothing if the town is emptying out. This chart cross-references cap rate with population growth – the sweet spot is the upper-right quadrant: strong cash flow and growing population.
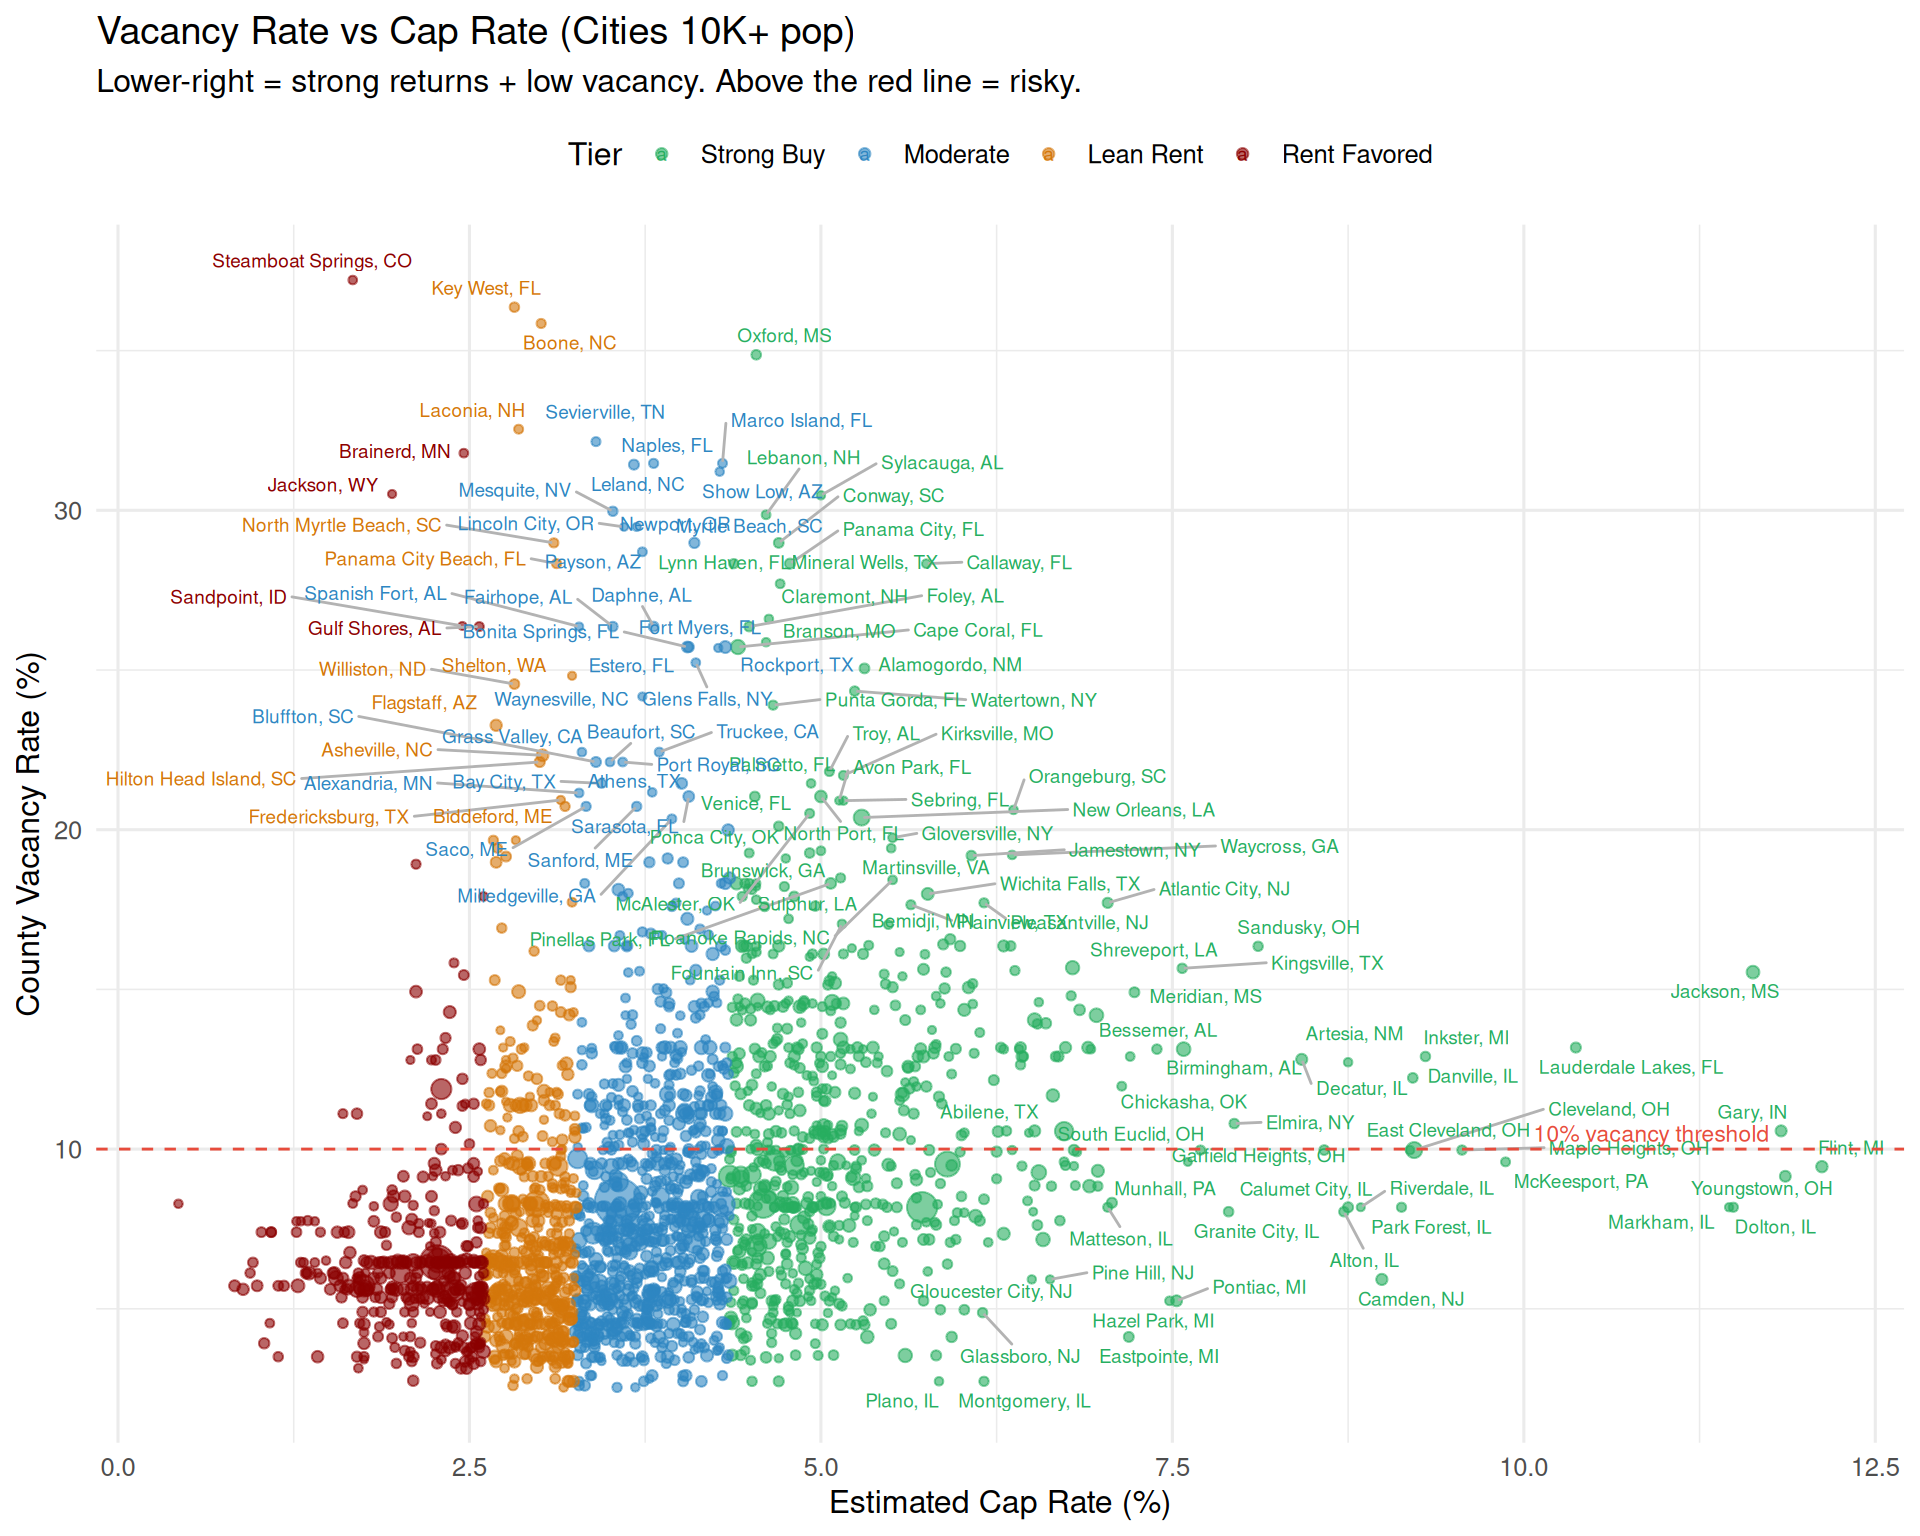
Vacancy Rate vs Cap Rate
Markets with high vacancy rates are risky – your rental sits empty longer. Cities in the lower-right have strong cap rates and low vacancy.
Full US Market Explorer
Search, filter, and sort all 4325 cities.
Show full table
Tier Distribution
Metro-Level Comparison
Average metrics across cities within each metro area (metros with 5+ cities).
Show metro table
How to update this data: Run
Rscript scripts/us_rental_markets_data.R to download Zillow
ZHVI + ZORI. Then run
Rscript scripts/us_rental_demand_data.R to merge Census
population, vacancy, and migration data. Then re-render this page.