LA Neighborhoods: Price per Square Foot
How much space does your dollar buy across Los Angeles? This page compares 35 neighborhoods by price per square foot — the ratio of median home price to typical home size. Neighborhoods are grouped into five tiers based on median home price:
- Ultra-Luxury ($3.2M–$7.0M): Bel Air, Beverly Hills, Holmby Hills, Malibu (Point Dume)
- Luxury ($2.3M–$3.0M): Beverly Crest, Hollywood Hills West, Manhattan Beach, Cheviot Hills
- Upper-Mid ($1.3M–$1.9M): Venice, Silver Lake, West Hollywood, Hancock Park
- Mid-Range ($1.0M–$1.3M): Highland Park, Echo Park, Atwater Village, Eagle Rock
- Affordable ($0.5M–$0.8M): Eastside LA, Koreatown, North Hollywood, El Sereno
Data Sources
All data is traceable and reproducible. Run
Rscript scripts/la_real_estate_data.R to refresh.
| Source | What | Updated |
|---|---|---|
| Zillow ZHVI | Typical home values (neighborhood & city level) | 2026-02-28 |
| Zillow ZORI | Typical observed rents (zip-code level) | 2026-02-28 |
| Redfin | Median sale prices, $/sqft | Manual; see source CSV |
| American Home Field | $/sqft study | 2025 |
Raw data files: la_neighborhoods.csv | Redfin sources | Zillow ZHVI extract | Zillow ZORI extract
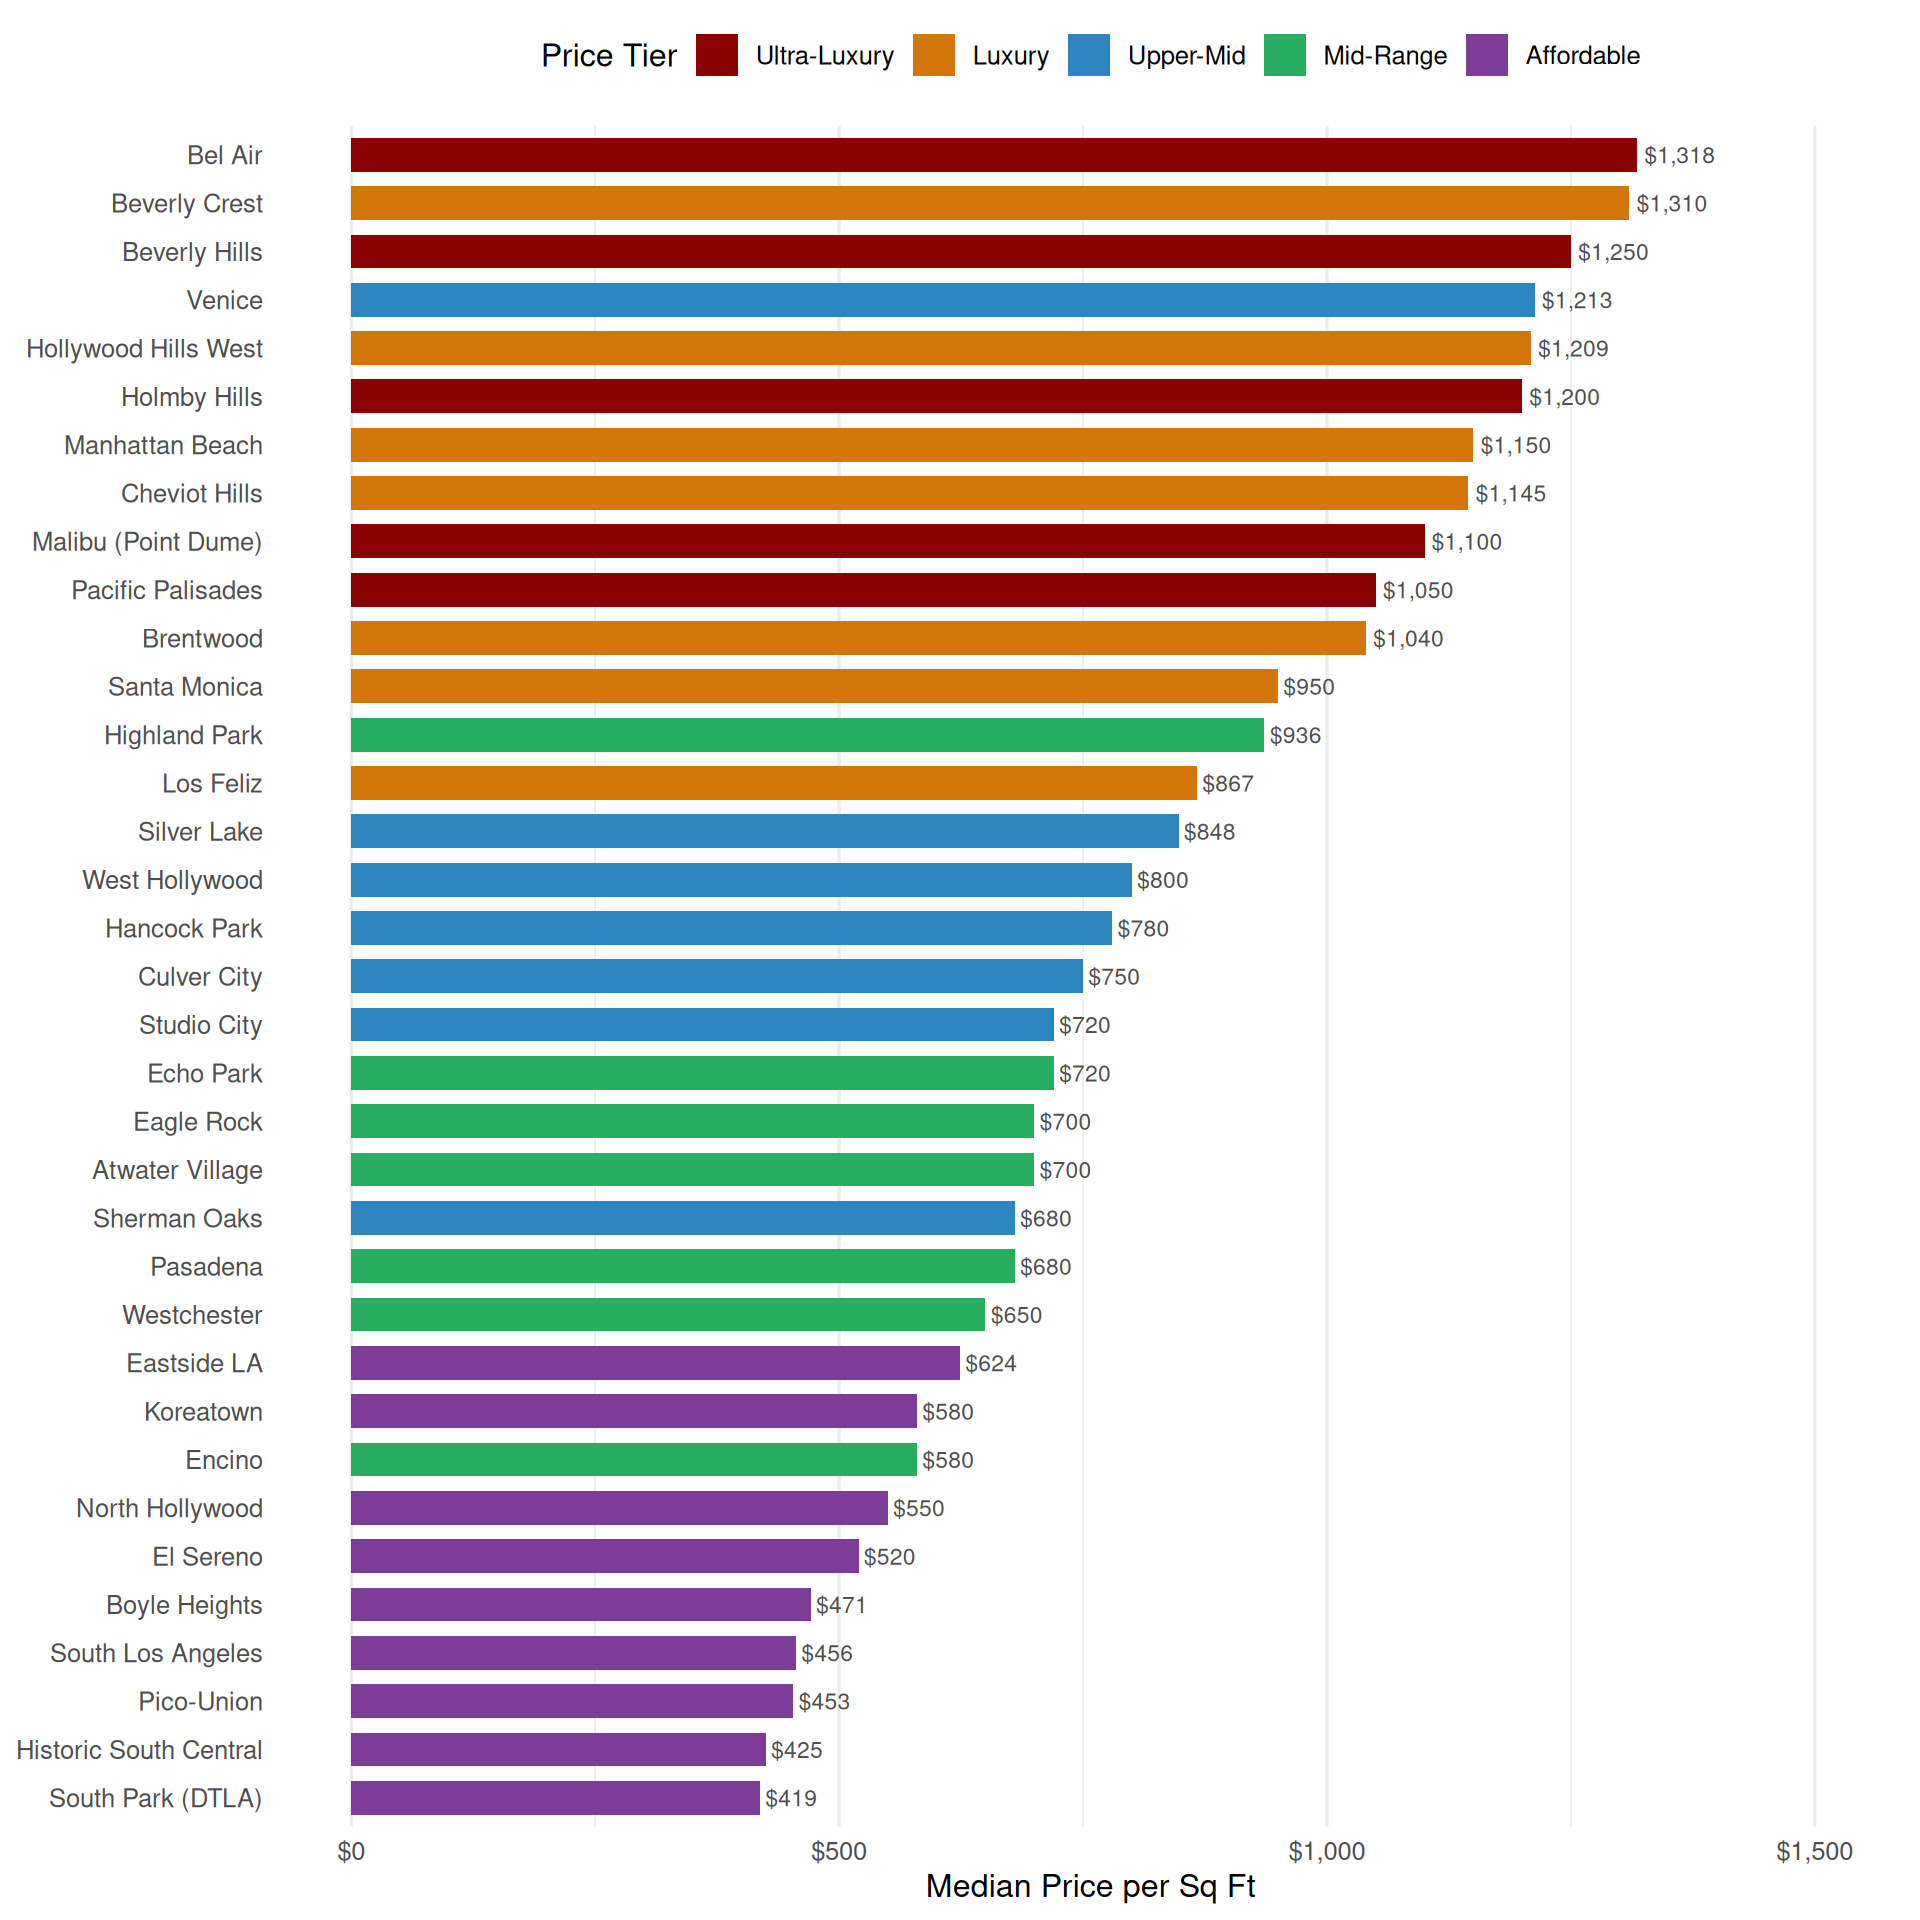
Price per Square Foot by Neighborhood
Bar Chart
Interactive Table
Show table
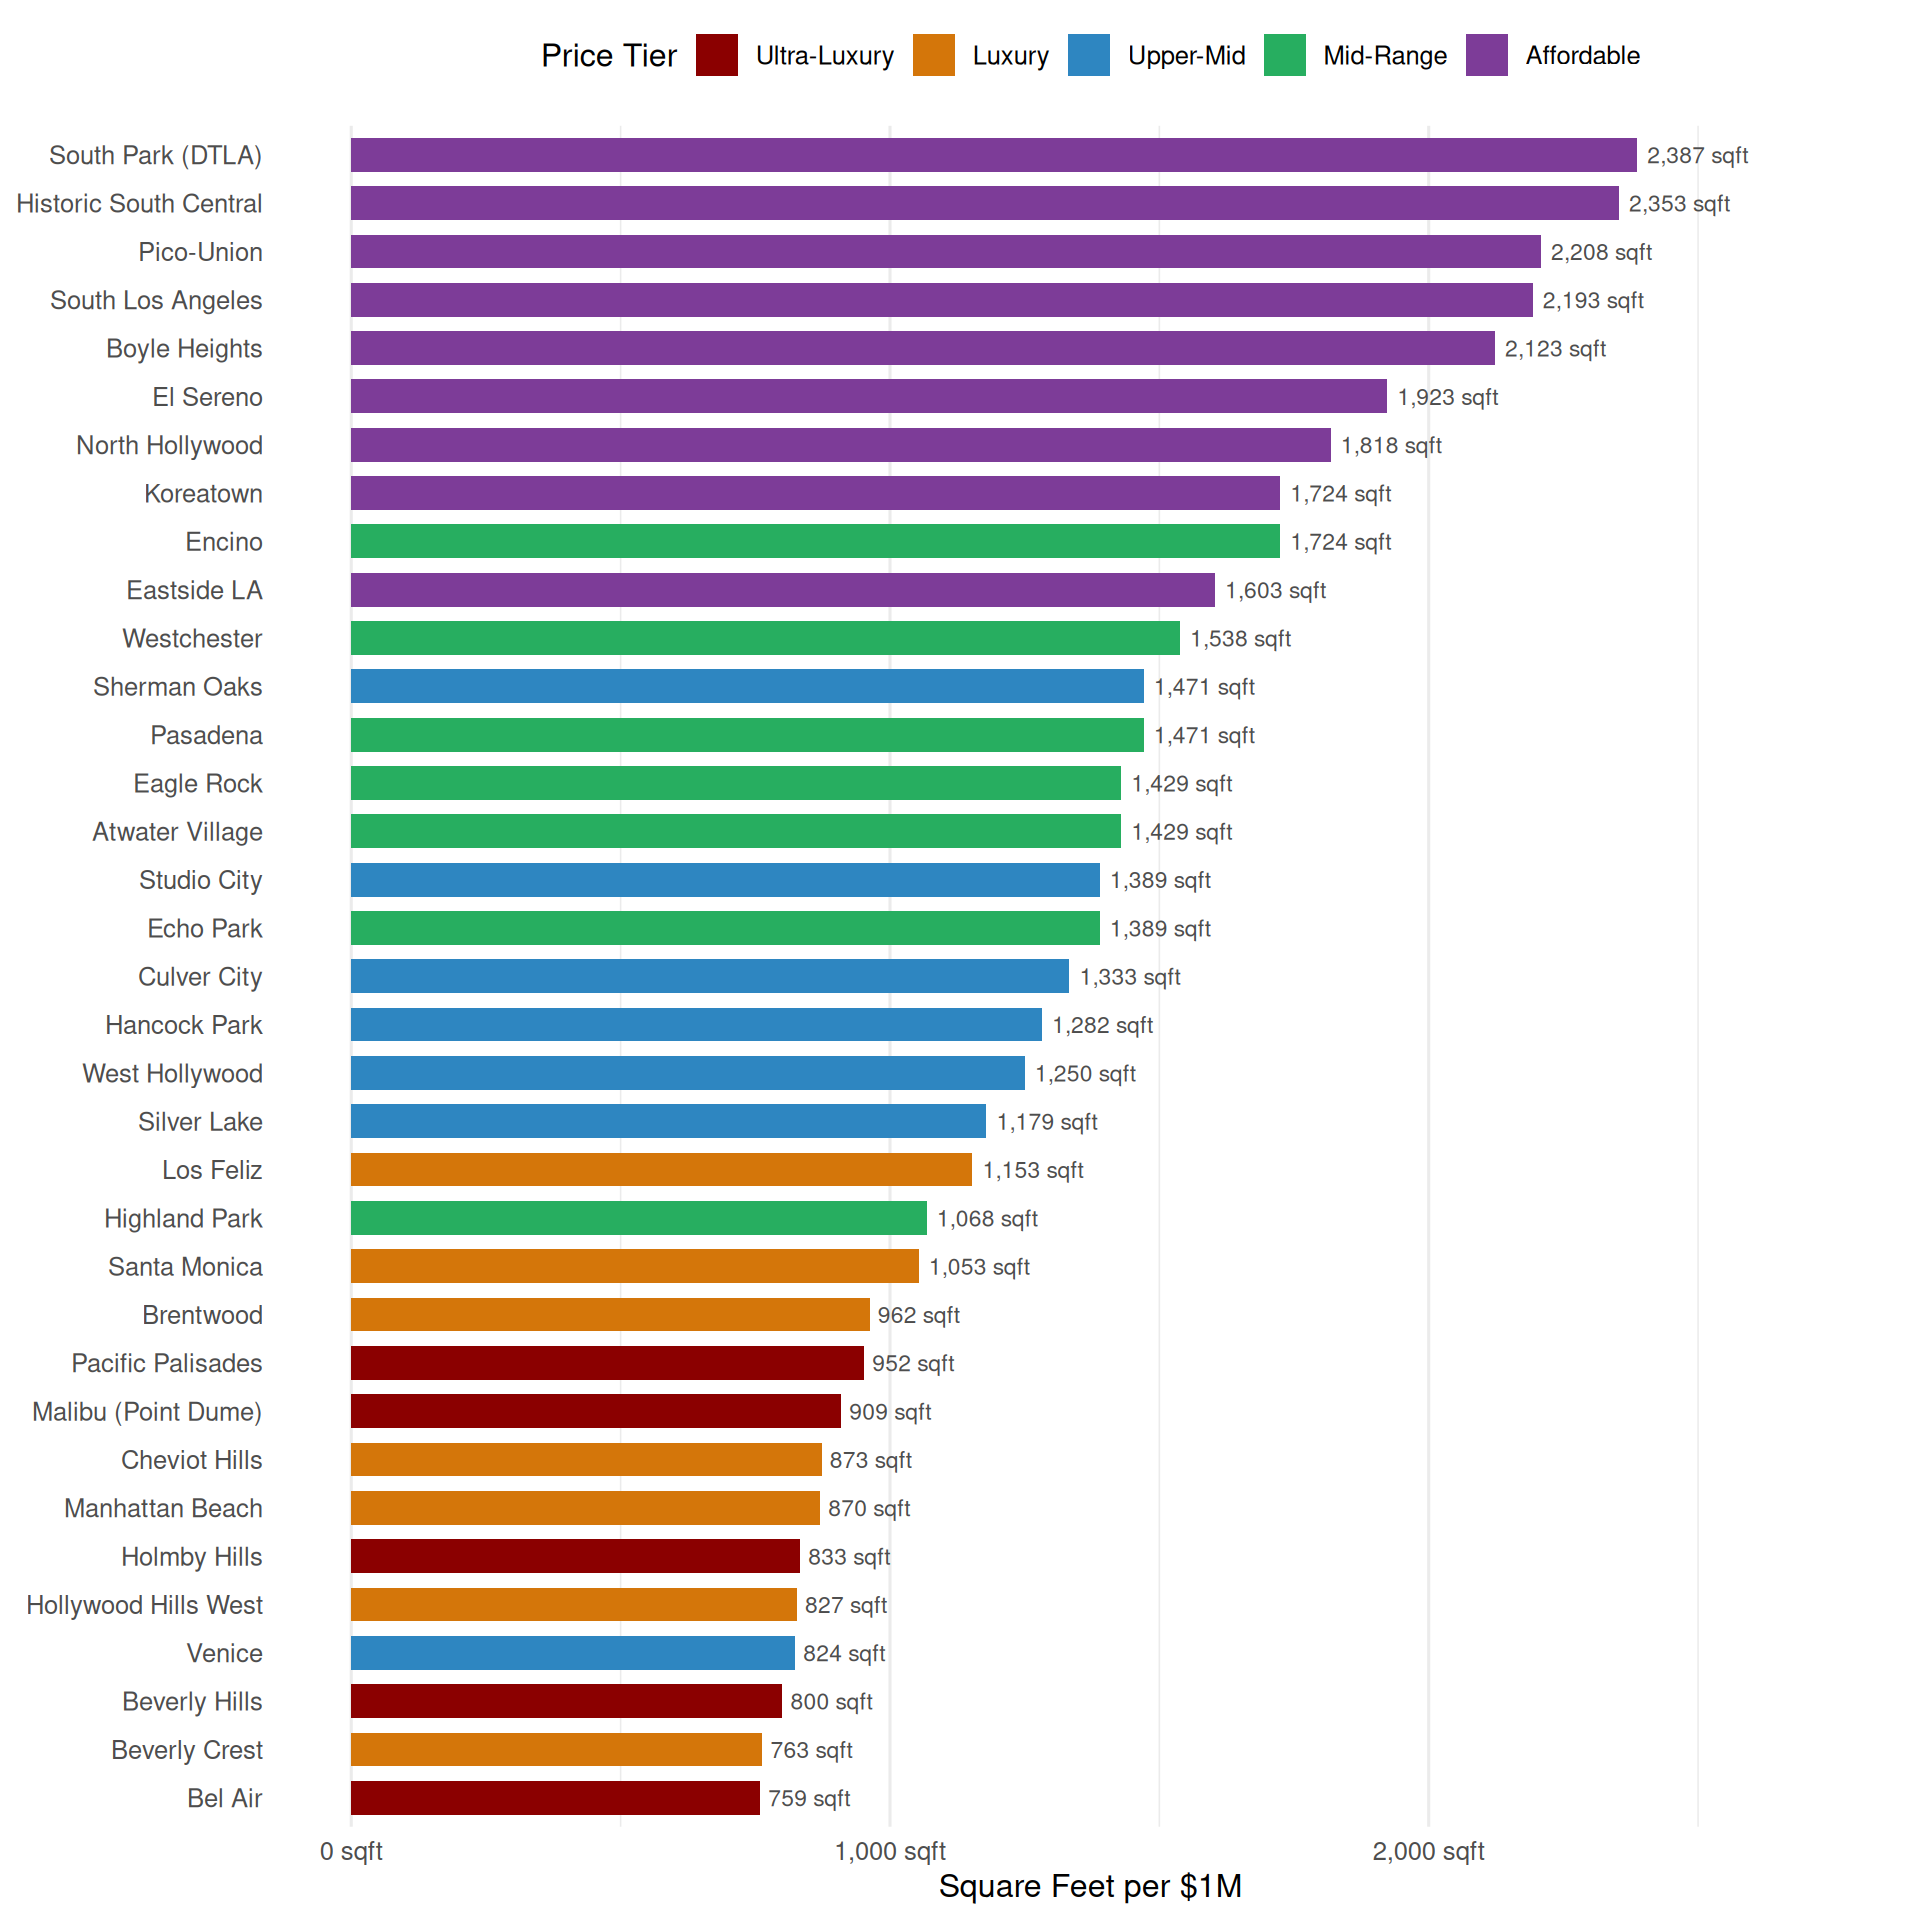
What Does $1 Million Buy You?
Bar Chart
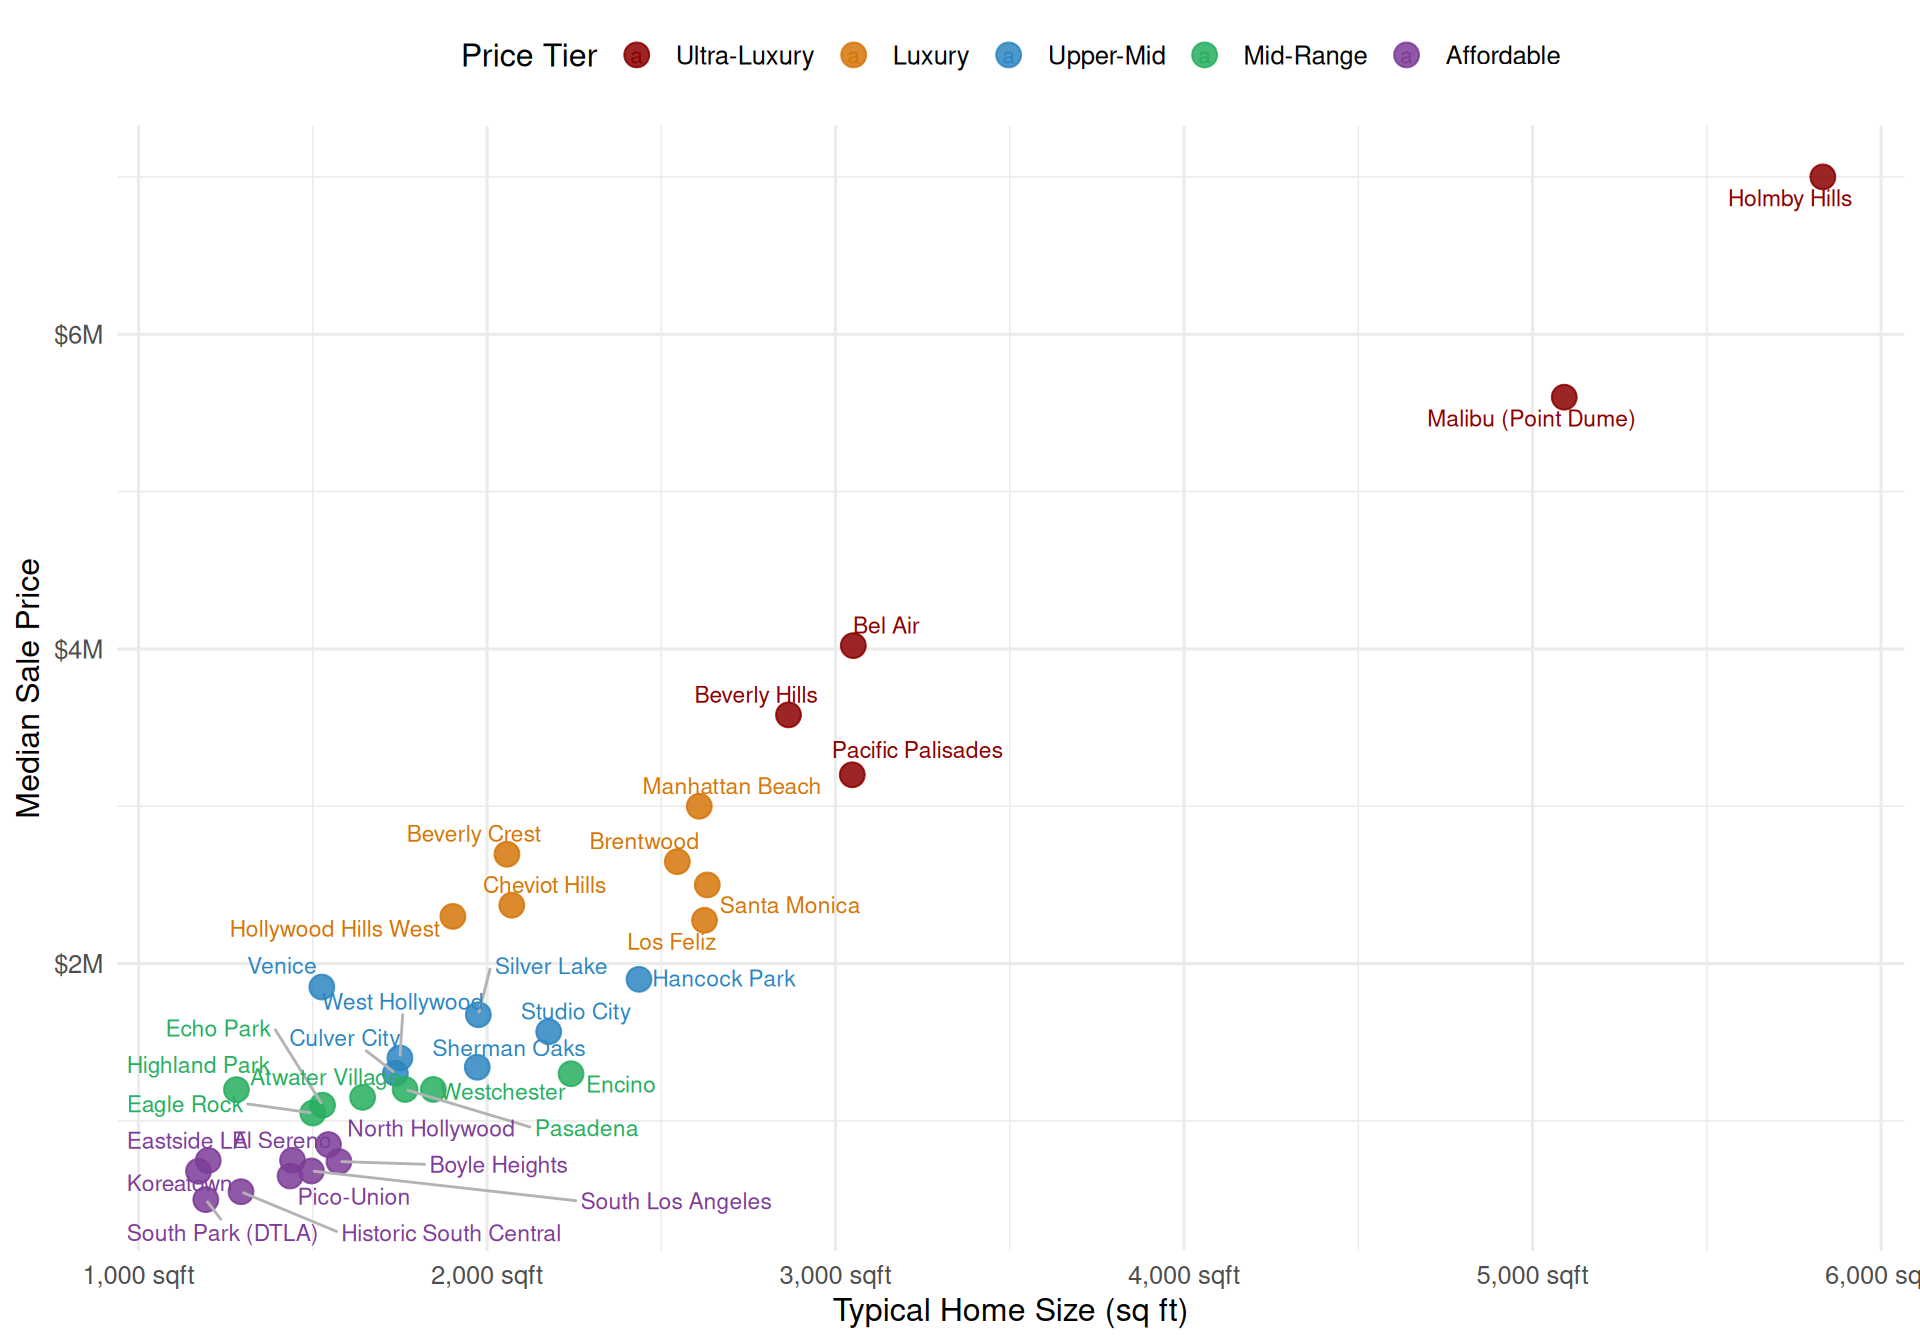
Scatter: Price vs Size
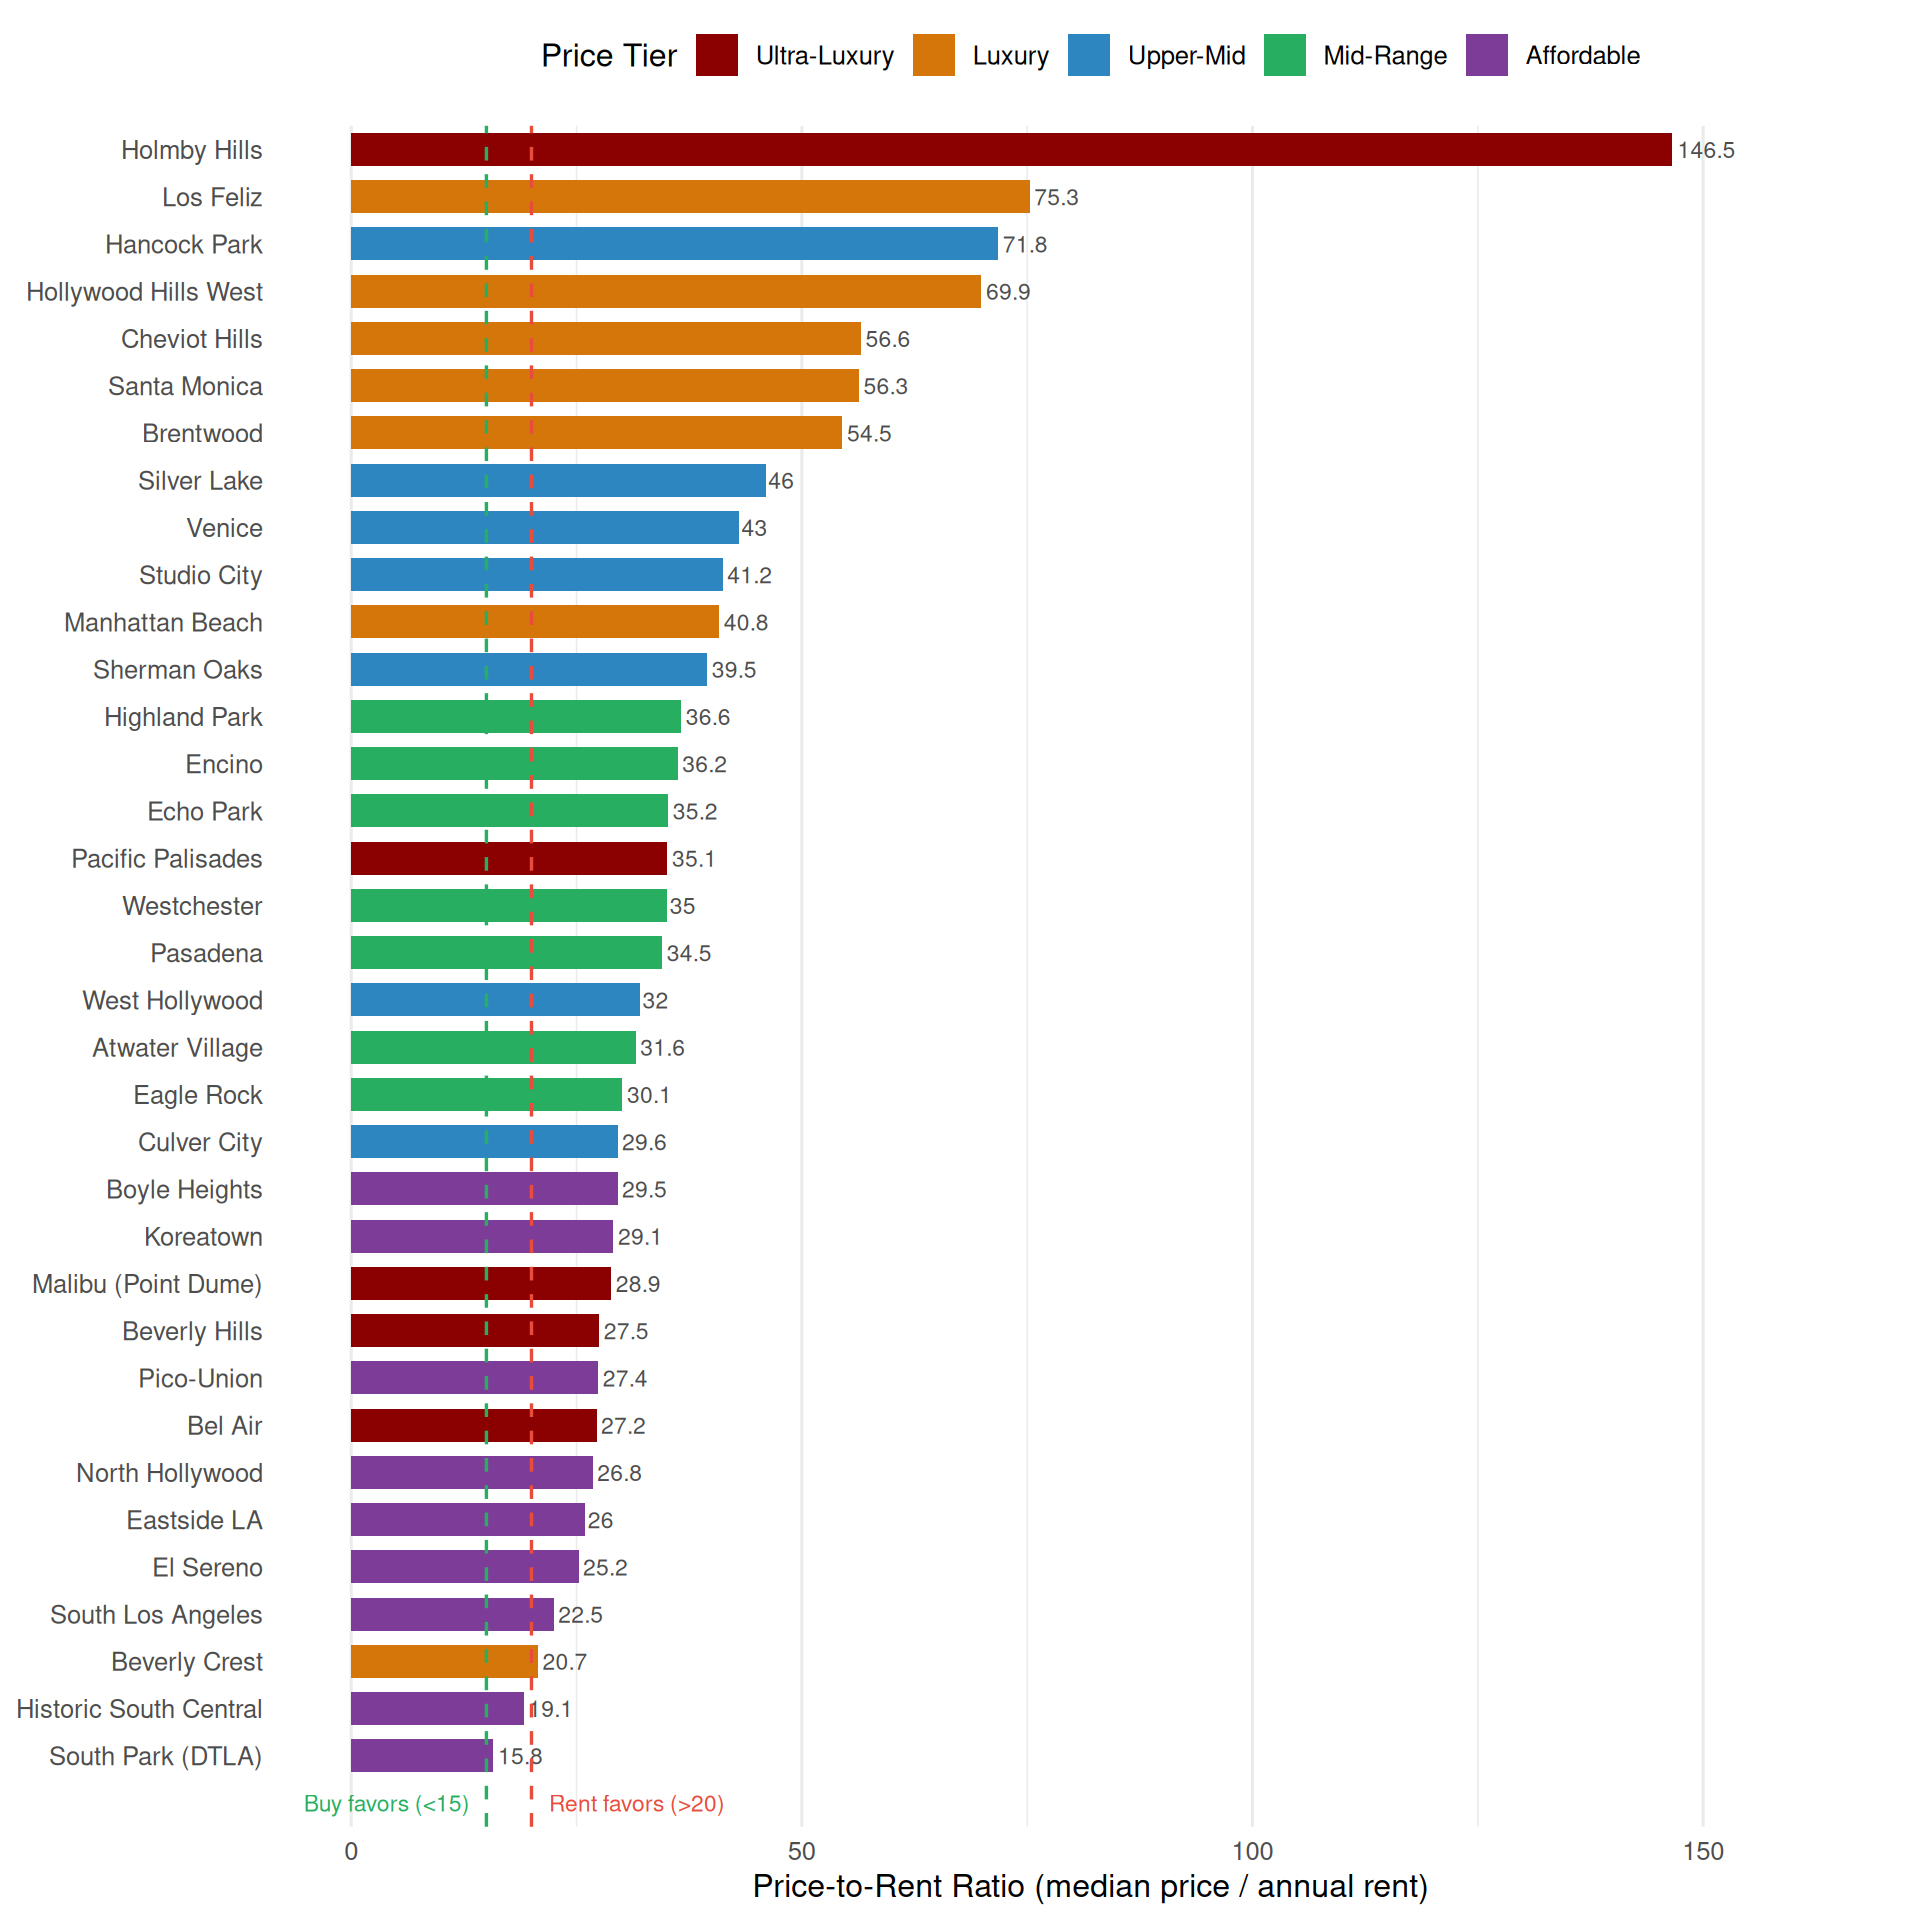
Price-to-Rent Ratio
The price-to-rent ratio divides median home price by annual rent. Under 15 favors buying; 15–20 is a toss-up; over 20 favors renting.
How to update this data: Run
Rscript scripts/la_real_estate_data.R to refresh Zillow
ZHVI/ZORI. For Redfin $/sqft and median sale prices, update
data/la_neighborhoods_redfin.csv with the latest values
from each neighborhood’s Redfin page (URLs are in the CSV). Then
re-render this page.